Delivered Is Not Deployed: Closing the Feedback Loop With Post-Update Telemetry
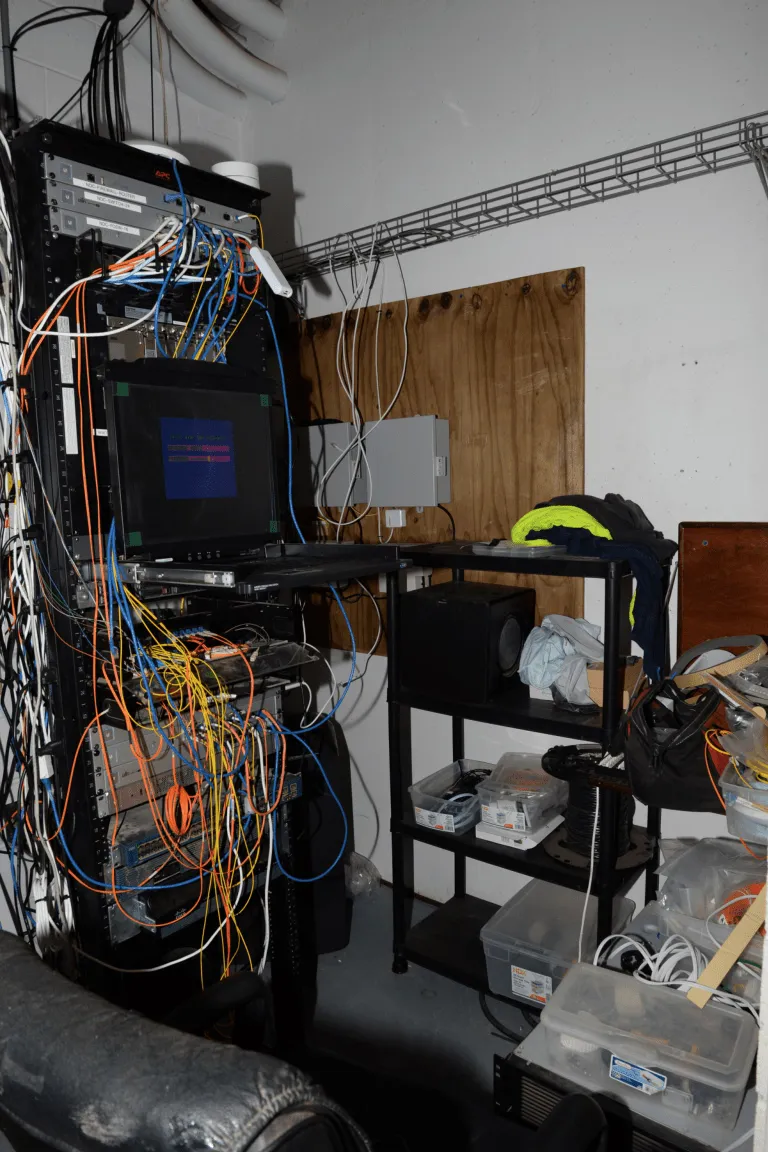
Photo: Federal Bureau of Investigation, Public domain, via Wikimedia Commons
There's a moment in every OTA pipeline that feels like the finish line: the device acknowledges the transfer, verifies the signature, and reboots onto the new image. The deployment chart ticks up to 100%. Someone posts the graph in Slack. Cue the celebration.
It's a premature celebration. Delivery is a logistics milestone, not an engineering outcome. The only honest definition of a completed update is one where fleet telemetry confirms the new firmware is behaving — boot counts are stable, error rates haven't moved, and the features you shipped are actually being exercised. Until those signals arrive, you haven't deployed. You've mailed a package to an address you've never verified.
The Baseline Problem
Post-update telemetry is meaningless without pre-update telemetry. If you don't know what normal looks like for firmware 2.4.1, you can't say whether 2.5.0 represents improvement or a slow-motion incident.
Before any rollout, capture a baseline across the dimensions your devices can measure: boot latency, watchdog resets, memory headroom, connectivity failure rates, battery drain profiles, and the invocation frequency of core subsystems. Segment that baseline by hardware revision, region, and even firmware age — a device that's been running 1.9 for three years behaves differently than one that upgraded last month. When 2.5.0 lands, your comparison is against a segmented baseline, not a fleet-wide average that hides the outlier cohort where the problem lives.
The Minimum Viable Heartbeat
Not every device can afford to phone home with rich diagnostics. A cellular-connected agricultural sensor on a metered plan has a very different telemetry budget than a plugged-in smart display. Design your post-update reporting in tiers:
Tier one — the survival signal. A single compact record, sent once shortly after first boot on the new image: firmware version, boot count since update, uptime, and a coarse health bit. This is the data that answers the only question that matters in the first hour — did the device come back up?
Tier two — the operational signal. Within the first 24 hours: memory and storage utilization, connectivity session success rates, and counters for any error paths you instrumented. This tier catches the classic slow failures — the leak that OOMs on day three, the TLS handshake that times out only on certain router firmware.
Tier three — the diagnostic signal. On-demand or sampled: crash logs, stack traces, subsystem traces. Expensive to collect, invaluable when tier one and two tell you that something's wrong and you need to know why.
A practical pattern: piggyback tier-one data on the existing check-in your devices already make to poll for updates. You're not adding a connection; you're adding meaning to one that exists.
Signals That Earn Their Bandwidth
Across consumer and industrial fleets, a handful of post-update signals have proven their worth repeatedly:
- Boot count and reboot reasons. A firmware that reboots twice in its first hour is telling you something. A firmware where reboots cluster in one code path is telling you where.
- Rollback detection. If your bootloader supports automatic reversion, that event is your loudest alarm and should be treated as a P1 signal, not a log line.
- Feature engagement counters. If the headline feature of 2.5.0 shows zero invocations across 40,000 devices, either the feature is broken, hidden, or misconfigured. All three are release problems.
- Resource deltas against baseline. A 15% rise in average RSSI retry rate after an update to the radio stack isn't a bug report — it's a bug report you didn't have to wait for.
- Battery and thermal drift. Especially for battery-powered fleets, a regression here shows up as a support ticket weeks later unless telemetry catches it in days.
From Firehose to Dashboard
Raw device telemetry at fleet scale is a data engineering problem wearing an embedded costume. Three principles keep it tractable.
First, aggregate at the edge of your ingestion path. Pre-compute per-version, per-hardware-revision rollouts in a stream processor so your dashboards query summaries, not millions of device rows.
Second, make the version the primary lens. Every chart in your observability stack should be sliceable by firmware version, with the previous stable version as an overlaid comparison. The question "is 2.5.0 normal?" should be answerable in one glance, not one query.
Third, automate the alarm, not just the chart. Define regression thresholds before rollout — reboot rate up 50%, error counter X up 20% — and wire them to your deployment tooling so a progressive rollout pauses itself. A human noticing a bad dashboard at hour nine is not a feedback loop; it's an archaeology project.
Designing the Loop In
The teams that do this well treat telemetry as a release requirement, not an afterthought. Every new code path in the firmware ships with its instrumentation — counters, timers, error codes — reviewed in the same pull request as the feature code. The release checklist includes baseline capture and dashboard configuration alongside the binary build. And the rollout plan specifies, in writing, which telemetry gates must pass before the cohort percentage increases.
This is the difference between OTA as a delivery mechanism and OTA as a reliability practice. The delivery mechanism gets firmware to devices. The practice makes sure the firmware deserves to be there. Build the loop from day one, and your hundredth release will feel as controlled as your first.
An update that ships without a feedback loop isn't an update. It's a coin flip with a changelog.